
IPAM: Where Math Creates Connections
This article was written by Roja Bandari, who graduated from UCLA in 2013 with a PhD in Electrical Engineering
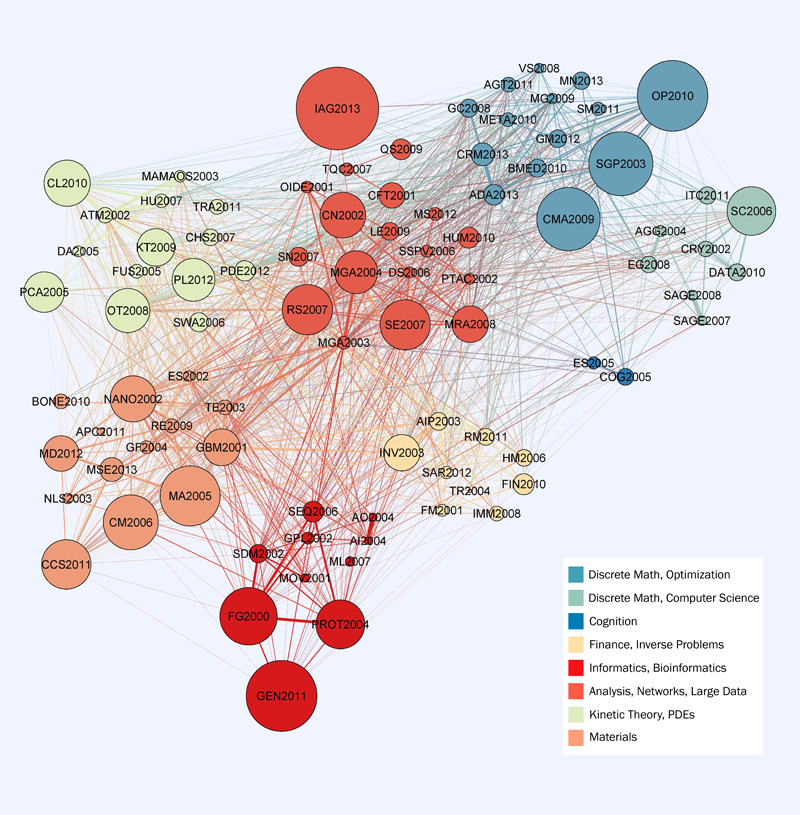
As a participant in the 2010 IPAM program “Networks and Network Analysis for the Humanities,” I formed an appreciation for IPAM’s ability to connect scholars of diverse fields. Organized by Dr. Timothy Tangherlini, the program led to research collaborations between mathematicians, computer scientists, and humanities scholars that continue today. Subsequently, IPAM’s director invited me to work on a special project: mapping the connections between IPAM programs. The following graph is the result of this work.
The graph represents the connections between IPAM programs (workshops and long programs) from 2000 to 2013. It also demonstrates the breadth of topics that are discussed at IPAM. Each node in the graph represents an IPAM program, and its size corresponds to the number of participants in the program. Clusters of programs, depicted in different colors, emerge naturally as a result of a graph-theoretic community detection algorithm. This is similar to the analysis of other networks, such as co-authorship networks in scientific publications.
The thickness of an edge connecting two nodes reflects the proportion of participants who took part in both programs. More specifically, the weight of an edge between two programs is equal to the number of their mutual participants divided by the number of unique total participants in the two programs (i.e., the Jaccard Index). Letting A and B be sets of participants in each program, the edge weight is \( (n(A \cap B))/(n(A \cup B)) \), where n represents set cardinality. A community detection algorithm then clusters programs such that the links between programs in the same cluster are more likely than those in different clusters. Each cluster, represented by a different color, reflects the interests of participants as demonstrated by the programs they attend.
As a hierarchical representation, this graph describes IPAM’s programs at various levels. At the coarsest level of clusters, it shows the range of application areas and of mathematical fields. At the level of programs, the graph shows that there are strong relations between programs, and at the finest level, these connections are seen to consist of interactions between individual participants across multiple programs.
You can read more about the community detection used in this analysis in the following: Clauset, A.; Newman, M.; and Moore, C. 2004. Finding community structure in very large networks. Physical Review E 70(6):066111, DOI:10.1103/PhysRevE.70.066111.
